Visualization of Physical Activity Patient-Generated Health Data for Clinical Care
-
Skills/Tools:
- Survey design
- Qualtrics
- Axure RP (prototyping software)
- Utility/usability evaluation design and execution
- Direct observation and notetaking

Goal: For this project, I examined the gap between physical activity patient-generated health data (PGHD) that are currently collected, versus formats or derivatives of PGHD that healthcare personnel would find useful. Specifically, this project focused on addressing PGHD data presentation in a way that minimizes information overload for healthcare personnel. To further narrow the scope, I focused on healthcare personnel at UNC’s Internal Medicine Clinic.
Method: To get a sense of current appointment workflows, I shadowed a physician and observed eight patient appointments at the clinic. This was followed by a survey of ten clinic healthcare personnel (including physicians, advanced practice providers, and medical assistants) to obtain a wider range of perspectives. Based on analysis of the results from this preliminary research, I created wireframes and mockups of a physical activity PGHD visualization system, and used Axure RP prototyping software to translate them into an interactive prototype. I then designed and conducted a utility and usability evaluation for this prototype.
Result: The resulting prototype included the following components:
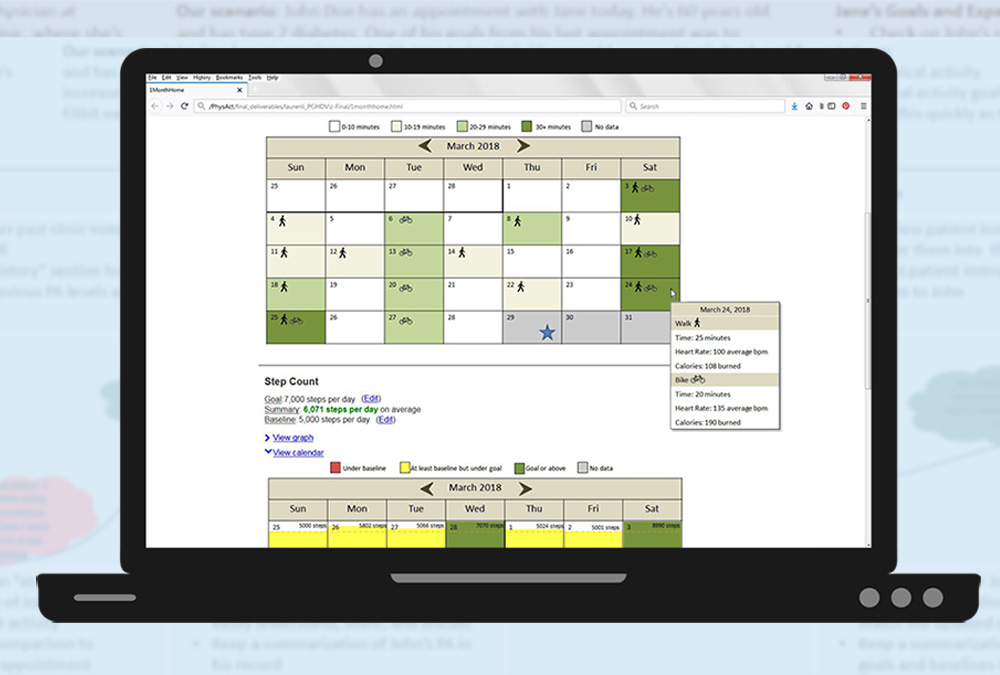
- Summaries for showing the patient’s minutes of moderate-to-vigorous physical activity (“active minutes”) and number of steps.
- Graphs with trendlines for both active minutes and steps, to help users discover global temporal patterns in the physical activity data.
- Calendars with individual days color-coded to indicate physical activity levels per day, to help reveal weekly and monthly periodic patterns in the data.
- Ability to change the timeframe shown in the visualization.
- Function to compare the present data with a “snapshot” of the patient’s past data.
The usability evaluation showed that the visualization system overall performed at a “fair” level (70 out of 100 on the system usability scale), and revealed areas for potential improvement. Due to time and resource constraints, the prototype evaluation was limited to one physician, but future iterations of testing should be conducted with more clinic healthcare personnel if possible. A full report containing additional details and results of this project is available via the Carolina Digital Repository (link).
Project Advisors and Mentors:- Project advisor at UNC School of Information and Library Science: Mary Grace Flaherty, PhD
- Mentors: Thomas Keyserling, MD, MPH with the UNC Internal Medicine Clinic and Alice Ammerman, DrPH, RD with the UNC Center for Health Promotion and Disease Prevention (https://hpdp.unc.edu/)