Global Viz: Opening Access to Global Opportunities with Visual Analytics
-
Skills/Tools:
- HTML
- CSS
- JavaScript (D3.js library)
- Wireframes, mockups
- Adobe Illustrator
- Microsoft Teams

Goal: The Global Viz team aimed to create an interactive visualization to help staff at UNC’s Center for Global Initiatives (CGI) identify intersections and trends in student application records for academic travel funding. This data was previously only viewable as rows of database or spreadsheet records. With the visualization of this data, we wanted to make the data easier to explore by applying Ben Shneiderman’s visual information-seeking mantra: “Overview first, zoom and filter, then details-on-demand”.
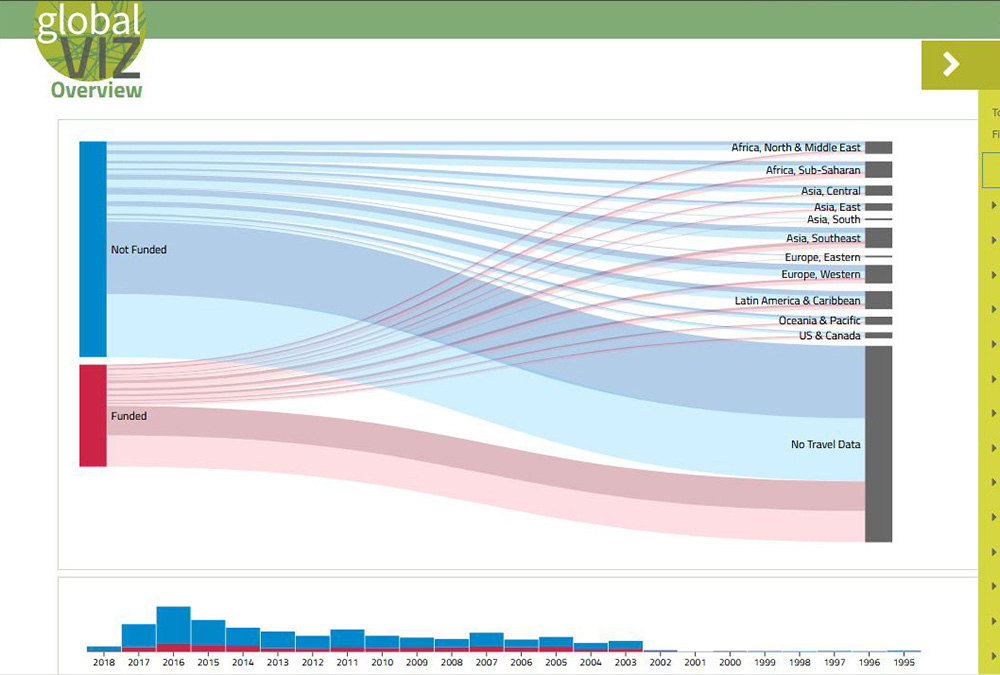
Method: Using Shneiderman’s mantra as a basis, our team created and presented visualization interface mockups to a client representative from CGI, and then worked with the client to design the user interface and interaction. We used the D3 JavaScript library develop the front-end visualization, and PHP to handle the back-end data processing. Throughout the project, we were continually evaluating our design, and went through several iterations of wireframing to make sure what we were developing was truly the optimal way to represent the data we were working with. I was most involved with the design process and the development of the Sankey chart.
Result: The Sankey chart provides a top-level overview of data that provides emphasis on funding status, travel region, and underrepresented status. The user can then use supporting filters and bar chart to zoom in on subsets of data by selecting specific demographics, year(s), travel location(s), funding status, and academic/professional interests. Details for the selected subsets are presented on-demand via an expandable section containing gauges and tree maps that highlight intersections of different aspects of the data. Possibilities for future work include smoothing the transition for the Sankey diagram when filters are applied, and incorporating an intuitive visual representation of the data intersections in the details section.
Teammates: Sophie Niu, Tripp Tuttle, Yaya Liu